Usedequipmentaddsvalue
57
ROUSESERVICES
IRNAPRIL-MAY 2015
Withnearly 100 years of industry
experience, RouseServices offers
business intelligencebackedby
constantlyupdatedaggregation
of equipment values and rental
metrics. RouseAppraisals values
approximately $30billion (€27.9
billion) of equipment, tracksmore
than 21,500makes andmodels,
andanalysesmore than$7.5billion
(€7billion) of retail, auction, and
trade-in sales of usedequipment
annually. RouseSales supports
client sales of over $425million
(€395million) inusedequipment
through the retail channel
annually. RouseAnalytics provides
monthly comparisons of pricing
and keyperformancemetrics to
localmarket industrybenchmarks
and tracks inexcess of $500
million (€465million) of revenue
monthlywith52 clients across
more than80markets.
■
Formore informationgo to
Definitions:
Rouse Forced LiquidationValue
Index
Theaverageauction (Forced
LiquidationValue) recoveries
expressedasapercentageof Original
Equipment Cost.
Forced LiquidationValue (FLV) The
estimatedgrossamount expressed
in termsofmoney that equipment
will typically realiseat aproperly
conductedpublicauctionwhen the
seller is compelled to sell asof a
specificdatewithinanapproximately
onemonthperiod.
RouseRate Index
Achieved rental rates relative to
January2011 (whenRouseAnalytics
started tracking ratedata) for a
basket of commonly rented items.
Physical Utilisation
Thepercentageof fleet costwhich is
on-rent duringagivenperiod. Aunit
is “on-rent” if it isat a jobsiteearning
rental revenue.
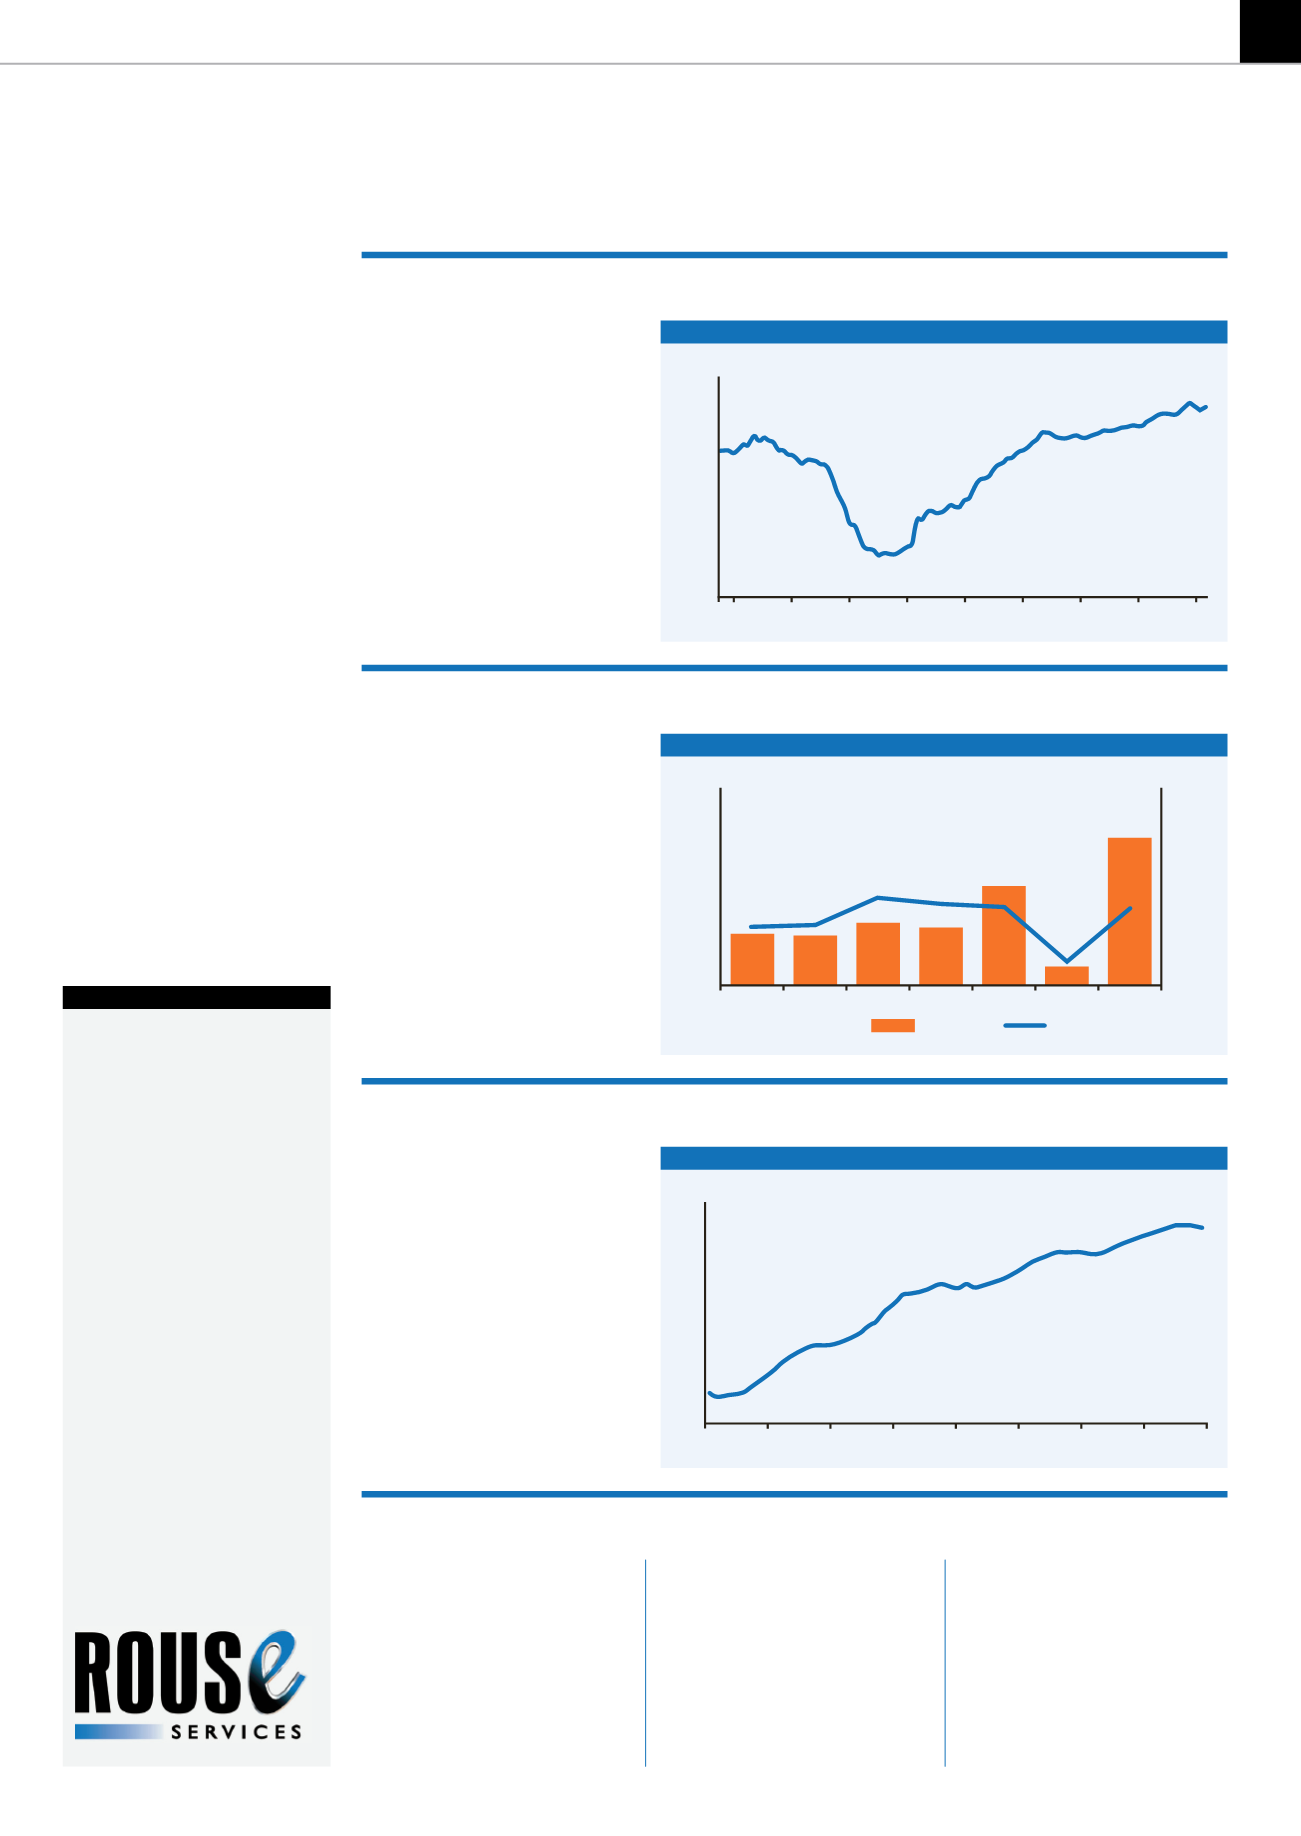
The February Rouse Value Index (RVI)
for used equipment prices increased
to 46.4, up0.5% from January values.
This is 7.2% higher than the prior
peak period of 43.3, in April 2007, and
56.5% higher than previous trough of
29.7, in June 2009. The RVI measures
the average Orderly Liquidation
Values for benchmark models across
14major rental category indices on a
monthly basis.
February auction sales of rental and
construction equipment tracked by
Rouse averaged 2.4% lower than
January Forced Liquidation Values
(FLV). Rouse recorded 6,067 units
that sold at 20 separate auction sales
conductedacrossNorthAmerica. The
units represented a combined FLV
(as of 31 January) of $200.8 million
(€186.8million) and generated $203.6
million (€189.4 million) of gross
auctionproceeds.
During December, achieved rental
rates as measured by the Rouse Rate
Index decreased 0.3% on average for
the rental companies participating in
the Rouse Analytics Rental Metrics
Benchmark Service. Rates are up
3.1% relative to December 2013 and
up 25.9% relative to January 2011.
December physical utilisation is down
7.9% fromNovember.
ROUSERATE INDEX: JAN2011-DEC2014
1.30
1.25
1.20
1.15
1.10
1.05
1.00
0.95
1.26
Jan
2011
Jan
2012
Jan
2013
Jan
2014
July
2014
Jan
2015
July
2011
July
2012
July
2013
ROUSEVALUE INDEX (RVI)
OLV (%OFCOST)
50.0
45.0
40.0
35.0
30.0
25.0
2007 2008
43.3
29.7
46.4
2009 2010 2011
2012 2013 2014 2015
AUCTIONVOLUMEANDRECOVERYRATE
VOLUME ($MILLIONS)
VOLUME ($MILLIONS)
SALEPRICE/FLV
RECOVERYRATE
240
180
120
60
0
110%
105%
100%
95%
90%
AUG
SEPT
OCT
NOV
DEC
JAN
FEB
RouseServices
shares its findings
on the state of the
US rental market
during thewinter
of 2014-15
FebruaryRouseValue Index up0.5%
Auction sales results down onJanuary
December drop in achieved rental rates
43.6


