9


            d


            &


            ri


          MAY-JUNE 2015
        
        
          100
        
        
          D&Ri’s
        
        
          annual ranking
        
        
          of theworld’s largest
        
        
          demolition contractors
        
        
          contains a few
        
        
          surprises this year.


            Lindsay Gale


          reports
        
        
          on the only global
        
        
          listing covering the
        
        
          demolition sector


            A


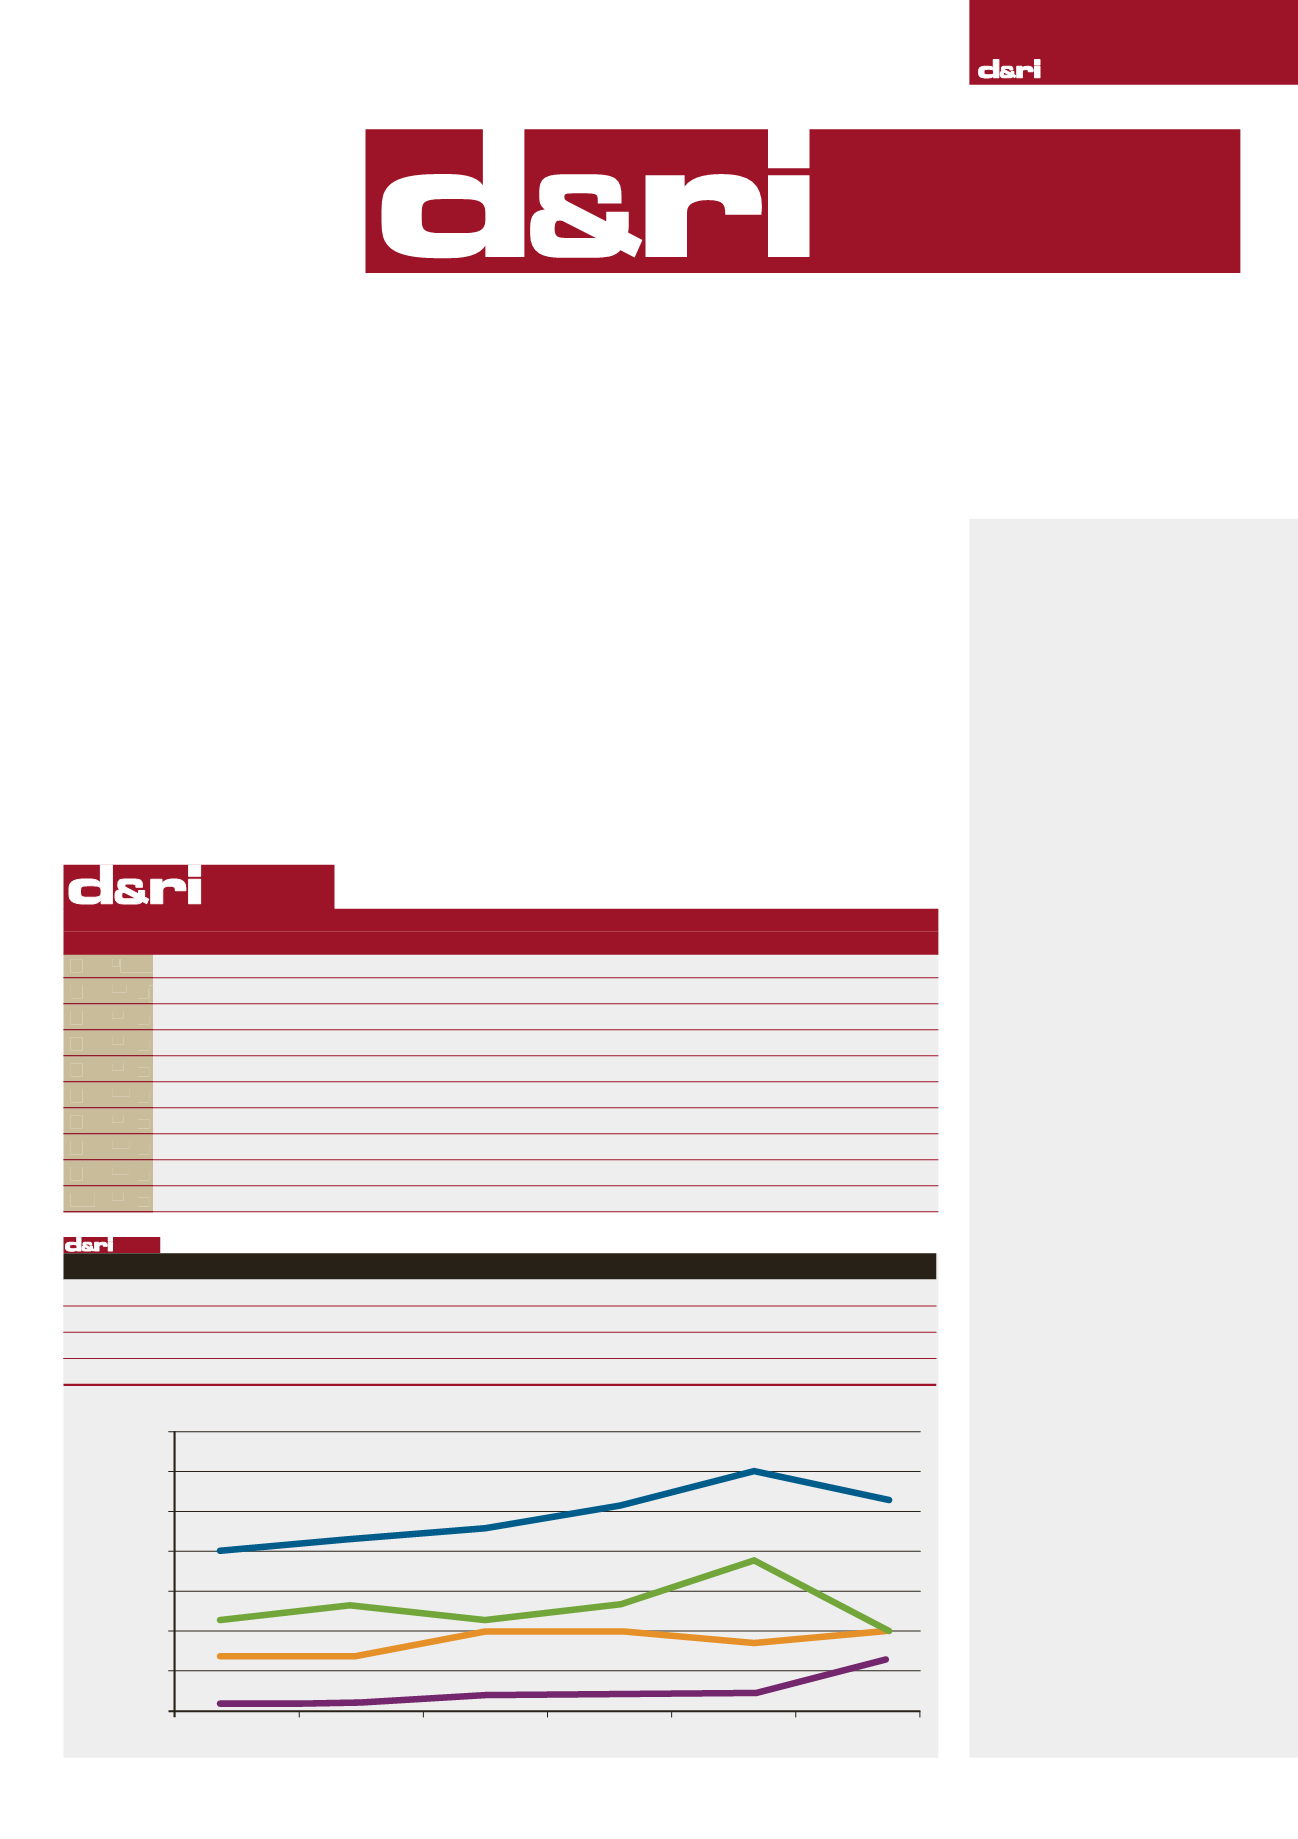
          t first glance, the lines
        
        
          of the graphbelow that
        
        
          display theperformance
        
        
          of thedemolition industry
        
        
          during2014might lead you to
        
        
          believe that times havebeen very
        
        
          tough for the sector globally,
        
        
          with the overall total of the 2015


            d


            &


            ri


          100
        
        
          fallingby11.7%, at
        
        
          just overUS$5.3billion, from
        
        
          the corresponding figureof just
        
        
          in excess ofUS$6billion last
        
        
          year. Thedatawould also suggest
        
        
          that it isEuropean contractors


            Corrective


            action


          100
        
        
          100
        
        
          100
        
        
          whohaveborne thebrunt of the
        
        
          downturn, with this region’s total
        
        
          fallingby almost 45% toUS$2.06
        
        
          billion fromUS$3.77billion as
        
        
          published last year.
        
        
          Readersmight recall that in
        
        
          last year’s report on the table,
        
        
          I perhaps over-confidently
        
        
          predicted that theUS$6billion
        
        
          barrierwould againbemore than
        
        
          comfortablypassed this year –
        
        
          such is thedanger of committing
        
        
          oneself inprint!
        
        
          However, one reasonbehind


            Sourcing


            the data


          As was the case last year,
        
        
          considerable resources
        
        
          were devoted to encourage
        
        
          contractors around the
        
        
          world to supply basic
        
        
          financial data concerning
        
        
          their activities during 2014.
        
        
          Where we were unable to
        
        
          obtain information from
        
        
          companies themselves,
        
        
          independent financial
        
        
          reporting services were
        
        
          consulted to obtain the
        
        
          necessary data. D&Ri
        
        
          never makes use of even
        
        
          informed estimates of annual
        
        
          revenues in the compilation
        
        
          of the


            d


            &


            ri


          100
        
        
          .
        
        
          We have endeavoured to
        
        
          ensure the accuracy of the
        
        
          figures used in the creation
        
        
          of the


            d


            &


            ri


          100
        
        
          ranking
        
        
          of the world’s top demolition
        
        
          companies but KHL can
        
        
          accept no liability for any
        
        
          errors or inaccuracies
        
        
          relating to the individual
        
        
          turnover figures contained in
        
        
          this report.
        
        
          D&Ri
        
        
          would like to
        
        
          encourage all companies
        
        
          that receive future requests
        
        
          for data for inclusion in the


            d


            &


            ri


          100
        
        
          to consider
        
        
          responding, as the greater
        
        
          the level of participation
        
        
          from contractors around the
        
        
          world, themore accurate
        
        
          and comprehensive future
        
        
          listings will be.


            Currency


            conversion


          Data that was supplied to
        
        
          D&Ri
        
        
          in currencies other
        
        
          than in US$were converted
        
        
          using the relevant exchange
        
        
          rates as of 6thMay 2015.


            YEARONYEAR


          2010
        
        
          2011
        
        
          2012
        
        
          2013
        
        
          2014
        
        
          2015


            d


            &


            ri


          100
        
        
          4,069.40
        
        
          4,337.90
        
        
          4,680.40
        
        
          5,106.10
        
        
          6,033.30


            5,328.89


            Americas


          1,439.00
        
        
          1,454.80
        
        
          1,938.10
        
        
          1,991.40
        
        
          1,732.40


            2,023.56


            Europe


          2,391.30
        
        
          2,627.70
        
        
          2,371.40
        
        
          2,707.60
        
        
          3,772.00


            2,060.54


            RoW


          228.90
        
        
          255.40
        
        
          366.30
        
        
          407.10
        
        
          528.60


            1,244.79


            7,000.00


            6,000.00


            5,000.00


            4,000.00


            3,000.00


            2,000.00


            1,000.00


            0


            US$M


            2010


            2011


            2012


            2013


            2014


            2015


            1


          (-)


            NorthStar


          New York
        
        
          USA


            479.70


            2


          (6)
        
        
          ▲


            Keltbray Ltd


          Esher
        
        
          UK
        
        
          236.50


            239.96


            3


          (4)
        
        
          ▲


            Brandenburg Industrial Services Co


          Chicago
        
        
          USA
        
        
          189.80


            215.10


            4


          (3)
        
        
          ▲


            Penhall


          Anaheim
        
        
          USA
        
        
          136.50


            202.58


            5


          (7)
        
        
          ▼


            Wanty SA


          Binche
        
        
          BELGIUM
        
        
          184.40


            168.30


            6


          (17)
        
        
          ▲


            DHGriffinWrecking Co Inc


          Greensboro
        
        
          USA
        
        
          109.40


            153.00


            7


          (8)
        
        
          ▼


            Eurovia Beton GmbH


          Magdeburg
        
        
          GERMANY
        
        
          168.00


            149.51


            8


          (13)
        
        
          ▲


            Erith Group


          Erith
        
        
          UK
        
        
          124.40


            145.01


            9


          (21)
        
        
          ▲


            Cherry Demolition


          Houston
        
        
          USA
        
        
          95.00


            127.50


            10


          (9)
        
        
          ▼


            McGee Group Ltd


          London
        
        
          UK
        
        
          156.90


            123.14


          POSITION
        
        
          TURNOVER (US$)
        
        
          15
        
        
          (14)
        
        
          COMPANY NAME
        
        
          LOCATION
        
        
          2013
        
        
          2014