T
he 2013 league table of global contractors is based on
revenues achieved in 2012. These came to US$ 1,530 billion
for the whole group, another record total.
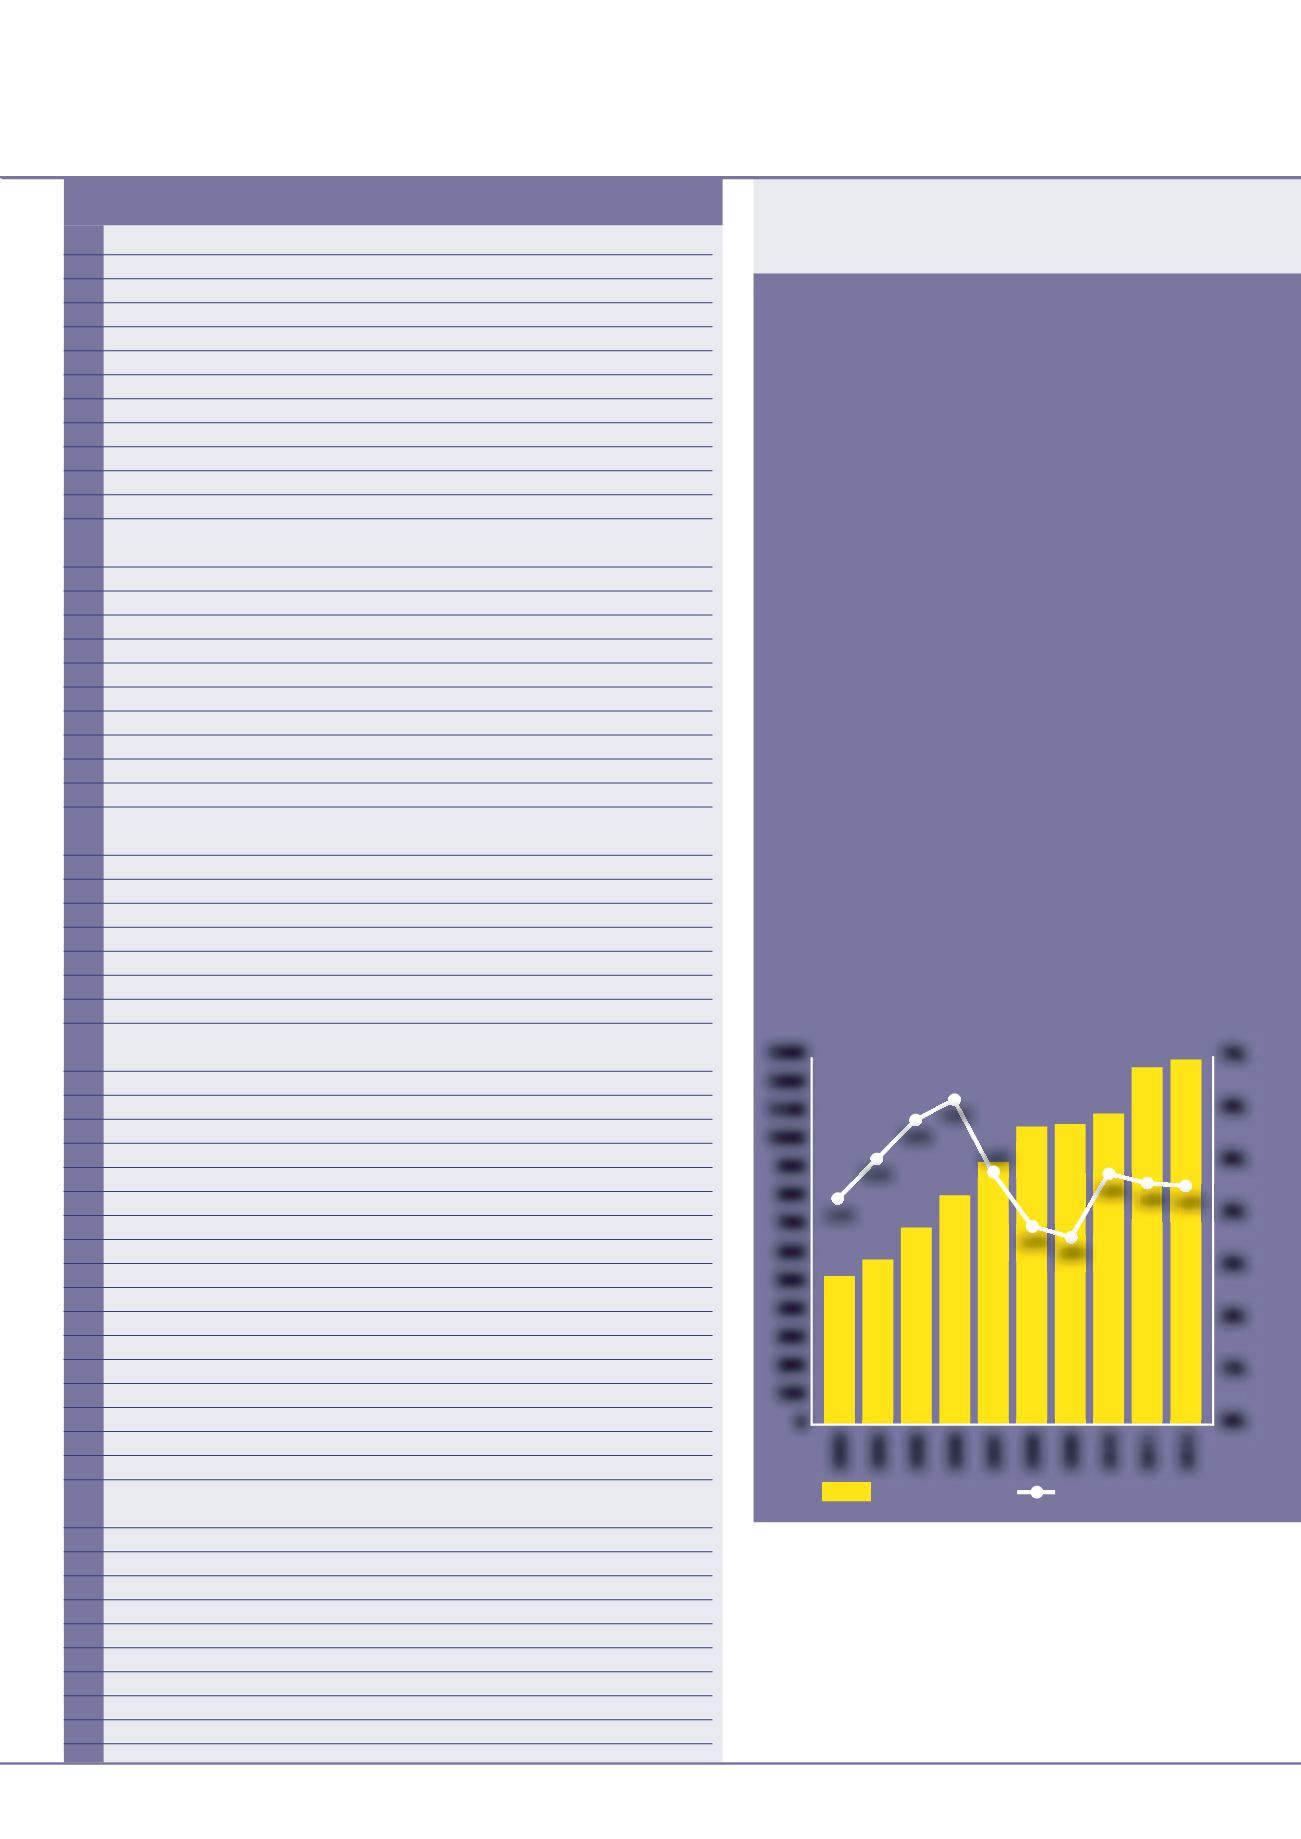
The graph illustrates the revenues and profitability trend for the
Top 100 going back a decade, and it is striking to note that there
have always been annual turnover rises, even in the years of global
recession. This year’s total for the top 100 came to US$ 1,292
billion, a +4% increase.
Although revenues have always improved, profitability in the
industry has been more sensitive to the changing economic
climate. The Top 100’s margin peaked in 2006 at 6.2% operating
profit. This was followed by a steep decline, driven first by the
downturn in the US residential market and then the global recession
that followed it. There was an improvement in 2010, as reported in
the 2011 edition of the Top 200 study, but since then profits have
flattened out. In 2012, the industry achieved an average margin of
4.4%, down 0.1 percentage points from 2011.
This fall in profitability and the relatively subdued +4% rise in
revenues for the top 100 suggests business conditions are still
tough for this group of companies, which could be indicative of the
whole industry. With global construction output somewhere around
the US$ 7,500 billion mark, the top 100 represent about 17% of
activity.
This statistic also reflects the fragmented nature of the global
construction market. It is difficult to think of another sector where
the top 100 companies have as little as a 17% market share and
the top 200 claim about 20%. Indeed, the global number 1, CSCEC
had revenues last year equivalent to only about 1.1% of global
construction output. There are not many other businesses in the
world where you could be market leader with a 1.1% share.
Global challenges
Industry profitability still weak
Sales Company
Country 2012 Change
Website
(US$ million)
1300
1200
1100
1000
900
800
700
600
500
400
300
200
100
0
7%
6%
5%
4%
3%
2%
1%
0%
Sales (US$ Billions)
Operating Margin
2003
520
2004
2005
>
2006
927
2007
2009
1096
1242 1291
2011
2012
2010
1048
2008
19
july-august 2013
international
construction
NEWS REPORT
The global top 200
* = estimate
4.3%
5.2%
5.8%
6.2%
4.8%
3.7%
579
695
807
3.6%
4.8% 4.5% 4.4%
1054
55
6751
China Gezhouba
China
50
5
56
6347
Emcor Group
US
66
10
57
6287
VolkerWessels
Netherlands 55
2
58
6266
Laing O’Rourke
UK
57
1
59
6224
Toda
Japan
69
10
60
6150
Kinden
Japan
64
4
61
6048
YIT
Finland
61
62
6001
PCL Construction Group
*
Canada
73
11
63
5816
Petrofac
UK
63
64
5812
Andrade Gutierrez
Brazil
46
18
65
5746
Enka
Turkey
75
10
66
5607
Kandenko
Japan
68
2
67
5542
Guangsha Construction
China
72
5
Group
*
68
5485
Chicago Bridge & Iron
US
80
12
69
5420
Spie
France
65
4
70
5343
Carillion
UK
54
16
71
5179
Obrascon Huarte Lain
Spain
52
19
72
4996
Chiyoda
Japan
113
41
73
4981
Aveng
South Africa 77
4
74
4945
Penta-Ocean Construction
Japan
87
13
75
4943
Misawa Homes Holdings
Japan
76
1
76
4822
Nippo
Japan
78
2
77
4820
Pulte Group
US
88
11
78
4674
Orascom Construction
Egypt
71
7
Industries
79
4644
Sacyr Vallehermoso
Spain
70
9
80
4623
Maeda Corporation
Japan
90
10
81
4575
Clark Construction
*
US
86
5
82
4385
Babcock International
UK
79
3
83
4381
Fayat Group
France
83
84
4354
D R Horton
US
98
14
85
4313
Murray & Roberts
South Africa 85
86
4292
Sumitomo Mitsui
Japan
89
3
Construction
87
4245
Brookfield Multiplex
Australia
120
33
88
4129
Alpine Bau
Austria
74
14
89
4111
Tutor Perini
US
95
6
90
4086
Lennar
US
118
28
91
3960
Boskalis Westminster
Netherlands 91
92
3782
Whiting-Turner Contracting
US
92
93
3754
Fujita
Japan
108
15
94
3639
Nexity
France
100
6
95
3624
PanaHome
Japan
96
1
96
3616
ICA
Mexico
104
8
97
3598
Ed Züblin
Germany
94
3
98
3542
McDermott International
US
103
5
99
3525
Jaiprakash Associates
India
116
17
100
3460
Walsh Group
US
102
2
101
3415
Foster Wheeler
US
81
20
102
3409
Tecnicas Reunidas
Spain
97
5
103
3386
Barratt Developments
UK
111
8
104
3371
Lotte Engineering &
South Korea 105
1
Construction
105
3366
Camargo Corrêa
*
Brazil
93
12
106
3313
Veidekke
Norway
114
8
107
3300
Black & Veatch
US
150
43
108
3270
Arcadis
Netherlands 132
24
109
3265
Kumagai Gumi
Japan
112
3
110
3199
Jan De Nul
Belgium
125
15
111
3189
NVR
US
135
24
112
3174
MRV
Brazil
184
72
113
3171
Nishimatsu Corporation
Japan
109
4
Most noticeable towards the top end of the rankings are the
large Japanese groups. Sekisui House. Kajima, Obayashi, Taisei
and Shimizu have all moved up since the 2012 league table and
now sit within the top 20.
Indeed, this trend for the large Japanese companies is reflected all
the way through this year’s top 200. Only two of the 32 Japanese
companies ranked in this year’s league table have lost places since
the 2012 league table was published, while an impressive 27 have


