The global top 200
international
construction
july-august 2013
NEWS REPORT
22
Country
No. of
New
Up
Down
Same
Total
% of Average Average
Average Average
companies
Sales
Total
Sales Operating
Headcount Sales/
(US$ mill.)
(US$ mill.) Profit
Margin
Employee
(US$ mill.)
(US$)
China
11
-
1
7
3
362880
23.7%
32989
1430
3.63%
125085 $285,677
Japan
32
2
27
2
1
228756
15.0%
7149
236
3.38%
8982
$846,649
US
30
3
15
9
3
183856
12.0%
6129
348
5.02%
20493
$314,174
France
7
-
2
2
3
125173
8.2%
17882
1492
7.41%
63419
$281,965
Spain
10
-
2
8
-
115138
7.5%
11514
347
2.62%
43981
$273,050
South Korea
11
2
7
2
-
66319
4.3%
6029
203
3.22%
7365
$870,485
UK
15
-
6
7
2
60975
4.0%
4065
184
4.52%
16567
$251,437
Germany
6
1
2
3
-
52797
3.5%
8800
240
1.95%
34149
$299,437
Sweden
4
-
1
3
-
36206
2.4%
9051
275
3.04%
25201
$359,171
Australia
3
-
2
1
-
35843
2.3%
11948
383
3.20%
29765
$401,406
Netherlands
9
-
1
7
1
34253
2.2%
3806
129
3.38%
6789
$575,798
Italy
6
-
2
4
-
30061
2.0%
5010
363
6.48%
15689
$357,655
Brazil
7
-
5
2
-
30026
2.0%
4289
785
12.14%
14750
$290,808
Austria
4
-
-
3
1
25644
1.7%
6411
41
0.57%
24426
$401,406
India
5
-
3
2
-
19992
1.3%
3998
452
11.30%
3908
$627,209
Canada
4
-
4
-
-
18897
1.2%
4724
299
5.42%
13743
$343,772
Norway
3
1
2
-
-
12399
0.8%
4133
207
5.01%
10428
$396,343
South Africa
3
-
2
-
1
11474
0.8%
3825
16
0.42%
17285
$221,278
Belgium
4
-
2
2
-
10837
0.7%
2709
181
6.69%
8697
$321,858
Russia
4
-
2
2
-
10689
0.7%
2672
190
7.15%
7306
$365,767
Finland
2
-
-
1
1
8963
0.6%
4481
174
3.88%
16119
$278,020
Turkey
2
-
2
-
-
8010
0.5%
4005
357
8.91%
7972
$502,440
Mexico
3
1
2
-
-
7331
0.5%
2444
427
17.47%
7432
$328,788
Egypt
2
-
-
2
-
6275
0.4%
3137
913
19.54%
12953
$242,220
Greece
1
1
-
-
-
1584
0.1%
1584
116
7.32%
12436
$127,408
Others
12
3
8
1
-
25417
1.7%
2118
-
-
-
-
ALL
200
14
100
70
16
1,529,795 100.0%
7649
357
4.30%
23,899
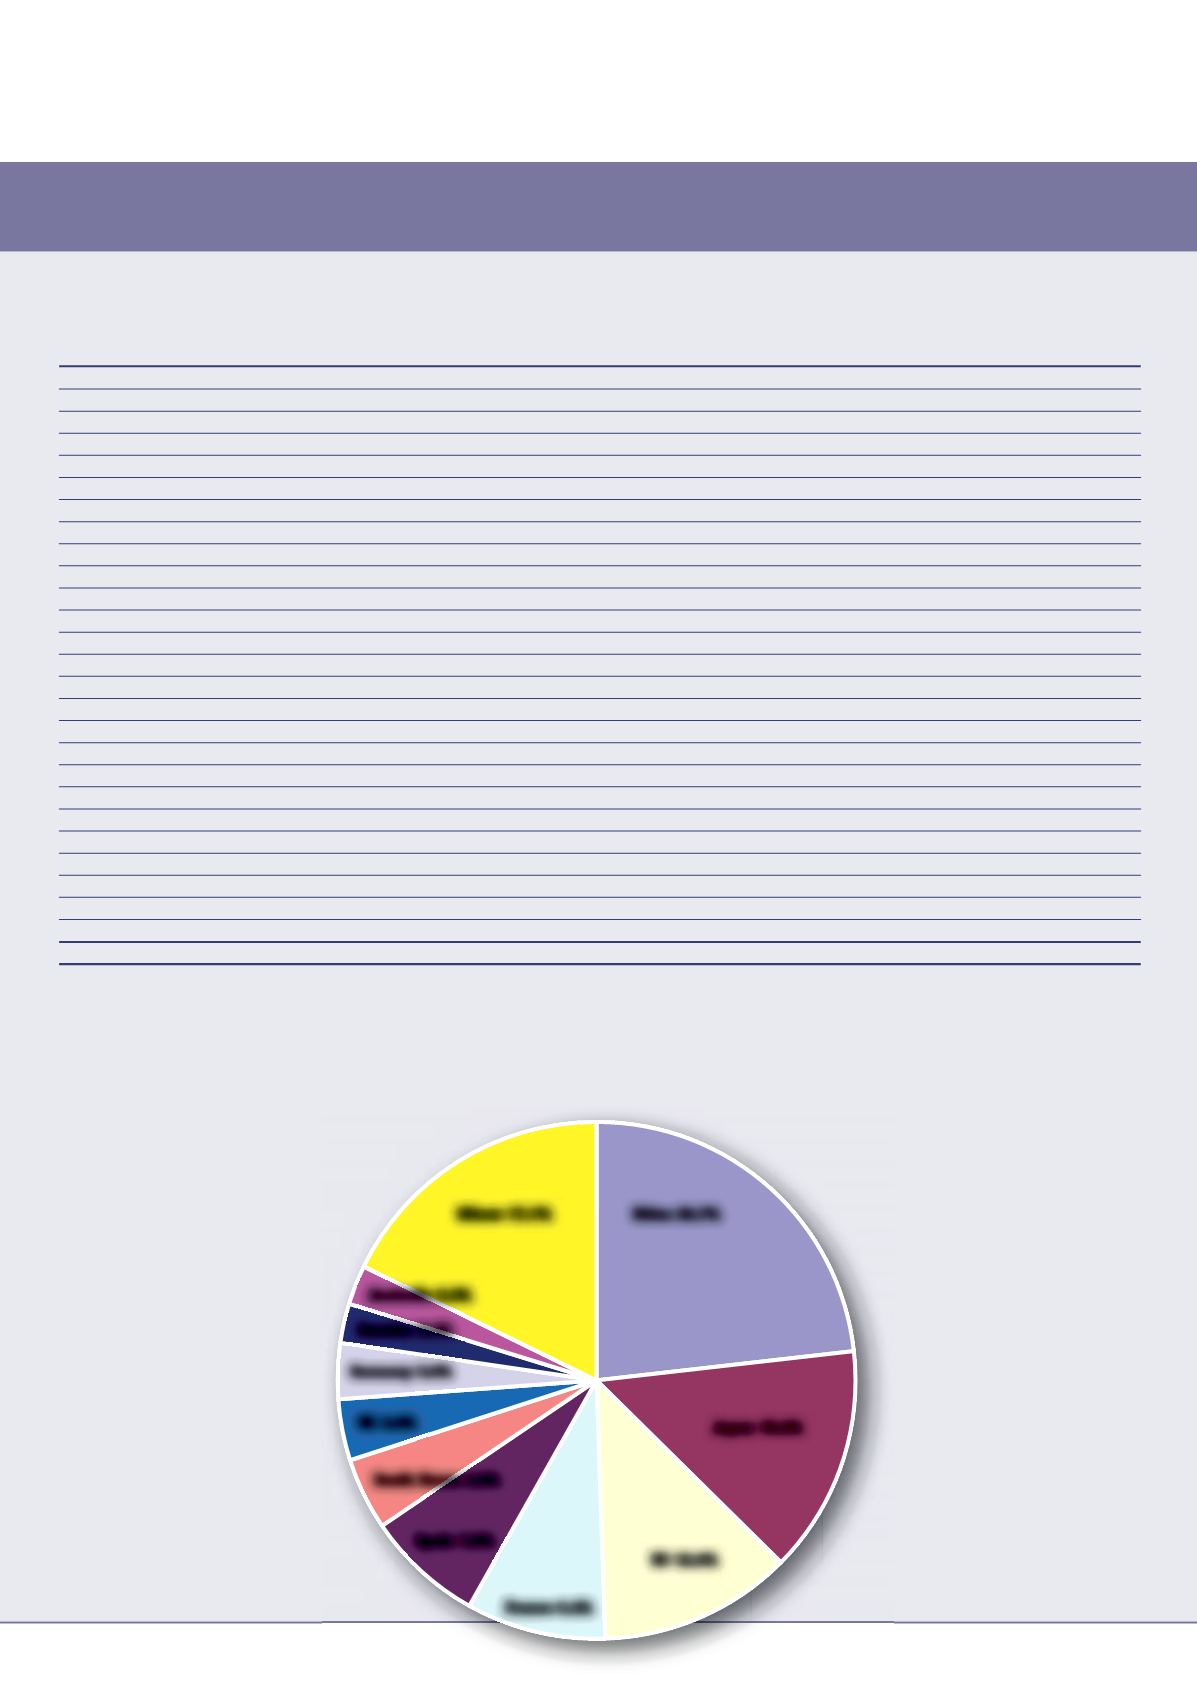
Analysis by country
Which country’s contractors are the biggest and most profitable?
D
espite falling revenues for many Chinese contractors last year,
robust growth by the three biggest players meant the country’s
construction companies claimed a slightly increased slice of
the top 200’s revenues last year – 23.7%, compared to 23.2% in the
2012 edition (based on 2011 figures).
Meanwhile a surge for Japanese contractors has seen their share
of the Top 200’s revenues move up from 14.2% in last year’s
study to 15.0% this year. US companies in the Top 200
meanwhile were almost unmoved with a 12.0% share
this year, compared to 12.1% last year.
Five years ago in the 2008 edition of the Top
200, US contractors enjoyed the biggest slice,
with a 19.9% share. They were followed by
the Japanese (15.5%) and French (9.9%).
Total revenues for China’s contractors
came to 9.7% of the total for the Top 200,
putting this national group in fourth place,
which emphasises how fast they have
grown as companies.
Global growth
Total revenues for the Top 200 came to
US$ 1,529 billion in this year’s study, a
+3.1% increase on last year’s total of
US$ 1,483 billion. This meant the average size
of a Top 200 company increased from US$ 7.41
billion to US$ 7.65 billion in revenue terms.
However, this was achieved without much of an
increase in headcount. Figures on employee numbers show that across
the Top 200, the average company now employs 23,899 staff – only a
+0.6% increase on the figure of 23,762 people per company from last
year’s analysis. This implies total employment among the top 200 of
about 4.78 million staff.
China’s contractors are the largest in revenue and employment terms,
but they are also among the least profitable in the Top 200, with an
operating margin of just 3.63%, compared to the average of
4.30%. Other under-performers in terms of profitability
include the Japanese, South Korean and Australian
national groups, along with most of the European
contractors.
The more successful national groups on
this basis are the US, Brazilian, Indian,
Mexican and Egyptian contractors, while
other emerging markets such as Turkey
and Russia also seem to deliver healthy
profits to their nation’s largest construction
companies.
About 75% of the companies listed in the
Top 200 are from developed markets and
they account for about 70% of the revenues.
Of the remaining 50 or so, 11 are Chinese,
leaving some 40 other emerging market
contractors. These tend to be the smaller
companies. They have total revenues of US$ 119
billion – just under US$ 3 billion each, compared to
the Top 200 average of US$ 7.65 billion.
Japan 15.0%
China 23.7%
France 8.2%
Spain 7.5%
UK 4.0%
Germany 3.5%
South Korea 4.3%
Sweden 2.4%
Australia 2.3%
Others 17.1%
US 12.0%
>


